

The use case: how Capillary Technologies deploys New Relic
Capillary uses New Relic One to monitor its microservices and servers across global regions, consolidate alerting, and troubleshoot incidents with metrics, distributed tracing and a thread profiler. Product managers and leadership also use custom dashboards to track product health and service level objectives.
More reported results
Figures published in New Relic’s case study. They are not independently measured by usedby.
Uptime and platform stability have also improved significantly, from 99.5% uptime to consistently hitting 99.9%.
What previously took around an hour has now been cut to just ten minutes.
We had incurred higher load balancing costs of about 40 percent (more) than usual, and it was due to a bug that was never caught.
In the customer’s words
The ability to have a microscopic view of each and every moving component via the New Relic dashboards and instrumentation is something which is very, very useful.Other companies using New Relic
Customers across industries, with public evidence.
See all New Relic customers




Go straight to the source
Based on New Relic’s published case study. We check the public evidence; the results are reported by the vendor.
newrelic.com- Last checked
- Nov 12, 2026
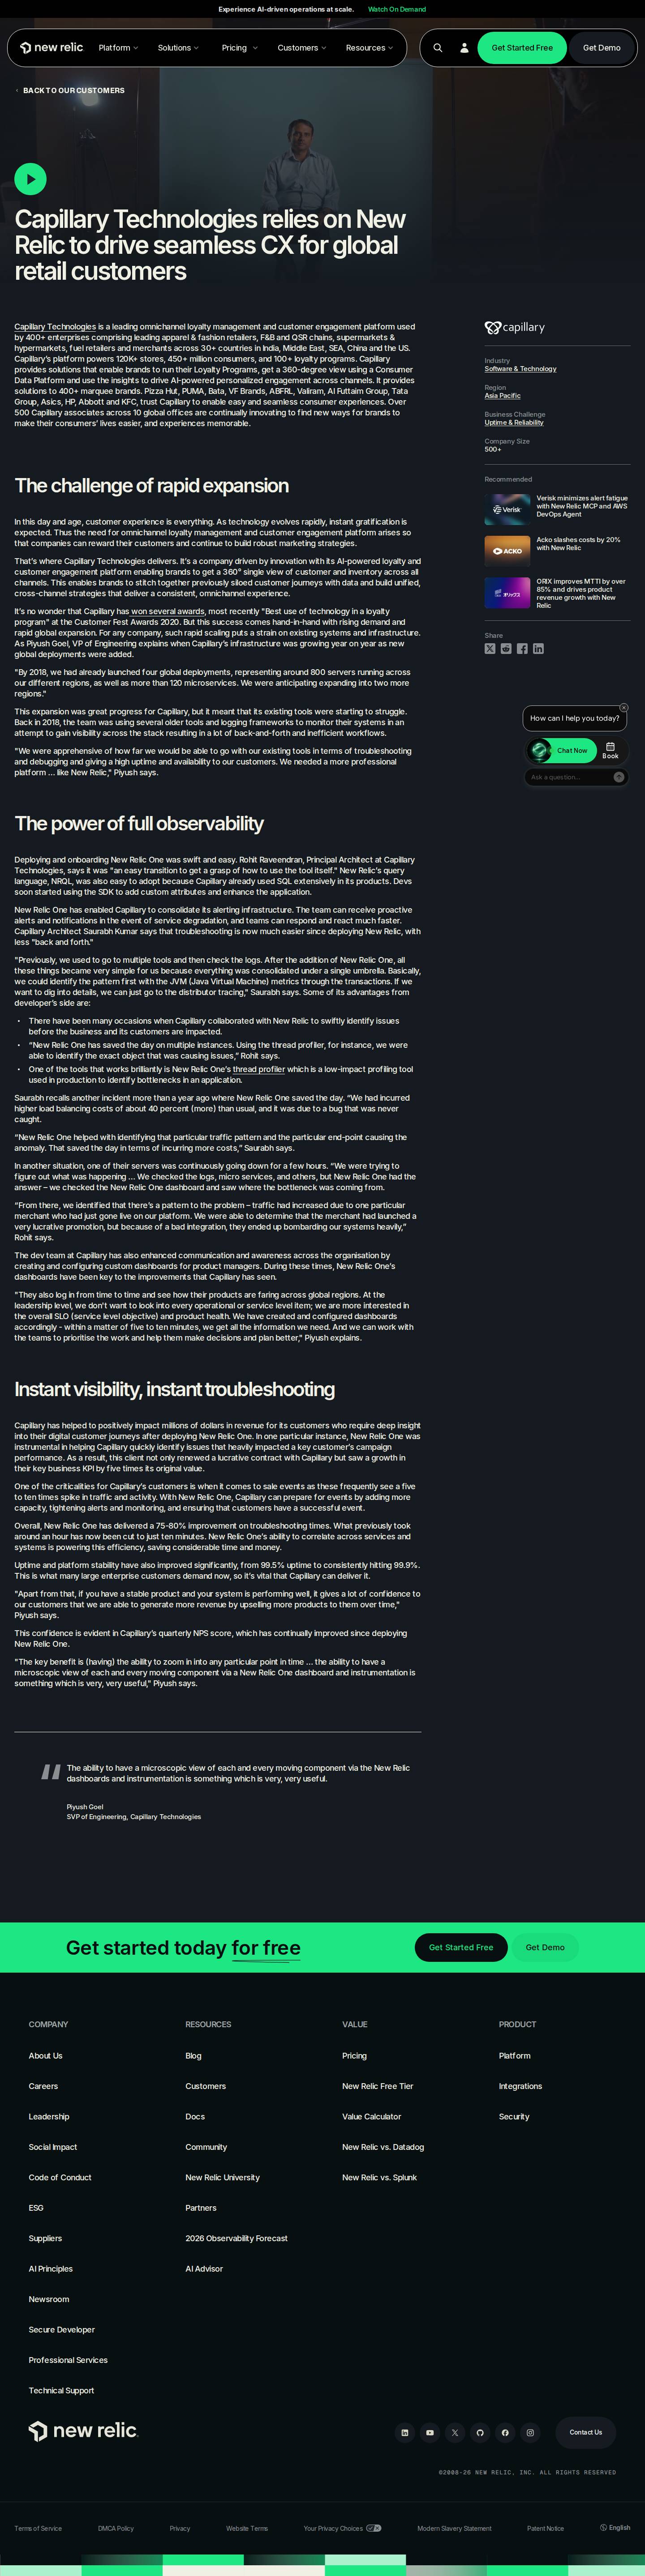 Open source capture
What the story claims, and what we checked
What we compared with the page.
- The figure: 75-80%Checked
Printed word for word on the page, near the name of Capillary Technologies.
- The passage quoted aboveChecked
Copied word for word from the page, near the name of Capillary Technologies.
- Capillary Technologies uses New RelicChecked
Confirmed line.
- The result itselfNot checked
We quote it; we did not measure it.
Overall, New Relic One has delivered a 75-80% improvement on troubleshooting times. What previously took around an hour has now been cut to just ten minutes. New Relic One’s ability to correlate across services and systems is powering this efficiency, saving considerable time and money.